Ambient air quality monitoring measures real-world outdoor pollutant concentrations — typically NO2, PM10 and PM2.5 — to provide planning, AQMA, baseline or permit-condition evidence. Alkali deploys MCERTS continuous monitors and NO2 diffusion tubes UK-wide within 1-2 weeks, with cloud-connected real-time data and planning-ready reports.
Read more about usShowHide
Ambient air quality monitoring UK for planning applications, baseline studies, AQMA evidence and Environmental Permit conditions — PM10, PM2.5, NO2 diffusion tubes and MCERTS continuous monitoring deployed nationwide across England, Wales, Scotland and Northern Ireland.
LAQM.TG(22) Survey Design
NO₂ Diffusion Tubes
Real-Time PM10 & PM2.5
Bias-Adjusted & Annualised
Boundary Dust Monitoring
UK-Wide Deployment
Ambient air quality monitoring in a nutshell
The short version for anyone who has been asked to prove what the air around a site or development actually contains.
Why you need it
Planning conditions, environmental permits, AQMA obligations and complaint investigations all need measured local data. DEFRA background maps alone are routinely challenged by Environmental Health officers and by objectors.
What we do
We design and run monitoring surveys to LAQM.TG(22): NO₂ diffusion tube networks, reference and indicative PM10 and PM2.5 monitors, dust deposition gauges, and continuous boundary monitoring with real-time alerting.
What you get
Bias-adjusted, annualised, distance-corrected datasets with full QA/QC, presented so they can be used directly for model verification, planning conditions or permit compliance — not just a spreadsheet of numbers.
How it starts
Tell us the site, the pollutants of concern and what the data has to prove. We propose a monitoring design, duration and fixed fee, usually within one working day.
Ambient monitoring readiness check
Eight questions that determine whether an ambient monitoring survey will produce usable, defensible data. Answer them here — nothing is sent anywhere.
1. Do you know exactly what the data has to prove — planning, permit, complaint or baseline?
Purpose sets everything else. Model verification needs annualised NO₂; a dust complaint needs directional real-time PM with meteorological data. The wrong design produces data nobody will accept.
2. Are the pollutants of concern agreed (NO₂, PM10, PM2.5, dust deposition, VOCs)?
Each pollutant has a different technique, detection limit and averaging period. Adding a pollutant mid-survey usually means restarting the dataset.
3. Is the required monitoring duration understood and allowed for in the programme?
LAQM.TG(22) expects a minimum of six months of diffusion tube data before annualisation, and 90% data capture for continuous monitors. Short surveys get discounted by reviewers.
4. Have monitoring locations been selected at relevant exposure, with a background site?
Tubes must sit at the façade of relevant receptors, not at the boundary, and a background or control location is what makes the results interpretable.
5. Is there a QA/QC plan — laboratory accreditation, bias adjustment, co-location, data capture?
Unadjusted diffusion tube results are not accepted for compliance work. Bias adjustment via the national factor or local co-location study is mandatory.
6. Will meteorological data be captured or sourced for the monitoring period?
Without wind speed and direction you cannot attribute exceedances to a source, which is the whole point of most boundary and complaint surveys.
7. Is site access, power and security available for continuous monitoring equipment?
Reference-equivalent analysers need mains or a managed solar/battery solution and a secure enclosure. Access constraints are the most common cause of lost data capture.
8. Is the reporting format agreed with whoever will review it?
Councils, the Environment Agency and planning consultants each expect different presentation. Agreeing the output up front avoids re-analysis at the end of a six-month survey.
0 of 8 answered — 0 already in place. Complete the check for your readiness verdict.
Published timescales, cost drivers and what makes monitoring data get rejected
What ambient monitoring genuinely takes, what moves the price, and the reasons reviewers discount datasets.
Typical monitoring durations
Survey type
Indicative duration
NO₂ diffusion tube survey (annualisable)
6–12 months, monthly exposure periods
Short-term indicative NO₂ screening
3 months minimum, with annualisation caveats
Continuous PM10 / PM2.5 monitoring
1–12 months depending on purpose, 90% data capture target
Construction boundary dust monitoring
Duration of enabling and construction works
Dust deposition (Frisbee / directional gauges)
Monthly cycles, typically 3–12 months
What actually drives the fee
Cost driver
Why it matters
Number of monitoring locations
Each location adds consumables, laboratory analysis and a site visit every exposure period.
Continuous versus passive technique
Reference-equivalent analysers carry mobilisation, power, servicing and telemetry costs passives do not.
Survey duration
Annualisation and data capture requirements, not budget, usually set the minimum duration.
Real-time alerting and dashboards
Telemetry, trigger levels and out-of-hours response add cost but prevent complaint escalation.
Site access and power
Restricted access, solar/battery power or secure enclosures increase mobilisation effort.
Six reasons ambient monitoring datasets get discounted
Diffusion tube results reported raw, with no national or local bias adjustment applied.
Fewer than six months of data used to represent an annual mean without a defensible annualisation.
Tubes or monitors sited at the site boundary rather than at relevant public exposure.
Data capture below 75–90%, with gaps not explained or infilled to a stated method.
No background or control location, so results cannot be separated from regional pollution.
No meteorological data, making it impossible to attribute exceedances to the site under investigation.
Monitoring that feeds straight into your assessment or permit
Ambient data is almost never the end point. It verifies dispersion models, supports planning submissions and evidences permit conditions — so we deliver the monitoring and everything it feeds into.
What it supports
Air quality assessment
EPUK/IAQM-compliant planning assessments verified against your own local monitoring rather than contested background maps.
Pre-submission review, regulator-ready documentation, and 14 days of post-submission query support are included as standard — to reduce refusal risk and enforcement delays.
Ambient Air Quality Monitoring for Planning, Baseline Studies and Compliance
Ambient air quality monitoring measures real-world pollutant concentrations in outdoor environments to support planning applications, regulatory compliance and public health protection. Whether you need baseline evidence for a planning submission, ongoing compliance monitoring for an Environmental Permit, or targeted investigation near sensitive receptors, ambient monitoring provides the measured data that planners, Environmental Health Officers and regulators require. Alkali Environmental delivers MCERTS certified and indicative ambient monitoring programmes nationwide across England, Wales, Scotland and Northern Ireland, with equipment deployed within 1-2 weeks and data reports delivered in planning-ready format. Add ambient air quality monitoring to the online quote basket, upload your planning or permit details, and a senior air-quality consultant will scope and price the campaign.
When Ambient Air Quality Monitoring Is Required
Ambient monitoring is commonly required in the following scenarios:
Planning applications near AQMAs, busy roads or industrial sources where local baseline data is needed
Environmental Permit conditions requiring boundary or receptor monitoring for PM10, PM2.5 or specific pollutants
Construction sites requiring real-time dust monitoring to IAQM guidance (see Construction Dust Monitoring)
Validation of Air Quality Assessment predictions and dispersion modelling assumptions
Community concern or stakeholder engagement requiring transparent, local monitoring evidence
Section 106 agreements or planning conditions requiring ongoing monitoring programmes
Industrial operations needing to demonstrate compliance with Air Quality Objectives
Development sites near schools, hospitals, care homes or other sensitive receptors
Pollutants We Monitor
Our ambient monitoring covers the full range of regulated and planning-relevant pollutants:
PM10 and PM2.5 — Particulate matter using gravimetric, TEOM, BAM or optical methods
NO2 and NOx — Nitrogen dioxide via diffusion tubes (Palmes-type) or continuous chemiluminescent analysers
SO2 — Sulphur dioxide for industrial and combustion sources
CO — Carbon monoxide for traffic and combustion assessments
O3 — Ozone for photochemical pollution assessment
Benzene, 1,3-butadiene and other VOCs — For industrial and traffic-related assessments
Heavy metals (Pb, As, Cd, Ni) — Via PM10 filter analysis for industrial compliance
TSP (Total Suspended Particulate) — For construction dust and industrial boundary monitoring
Monitoring Methods and Equipment
We deploy the right equipment for the monitoring objective, from cost-effective diffusion tubes to MCERTS-certified continuous analysers:
Palmes-type NO2 diffusion tubes — 2-4 week exposure periods, ideal for baseline screening at multiple locations
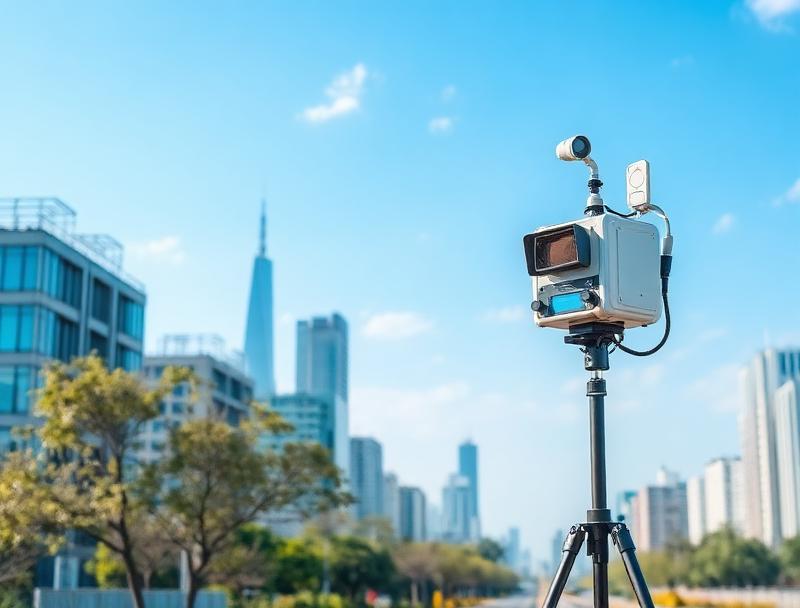
MCERTS continuous PM10/PM2.5 monitors — BAM-1020, TEOM or equivalent for real-time regulatory-grade data
Osiris and Turnkey Topas units — Indicative real-time PM monitoring for construction dust and short-term investigations
Chemiluminescent NOx analysers — Continuous NO/NO2/NOx measurement for industrial and roadside monitoring
Automatic weather stations — Co-located meteorological data (wind speed, direction, temperature, humidity) for source attribution
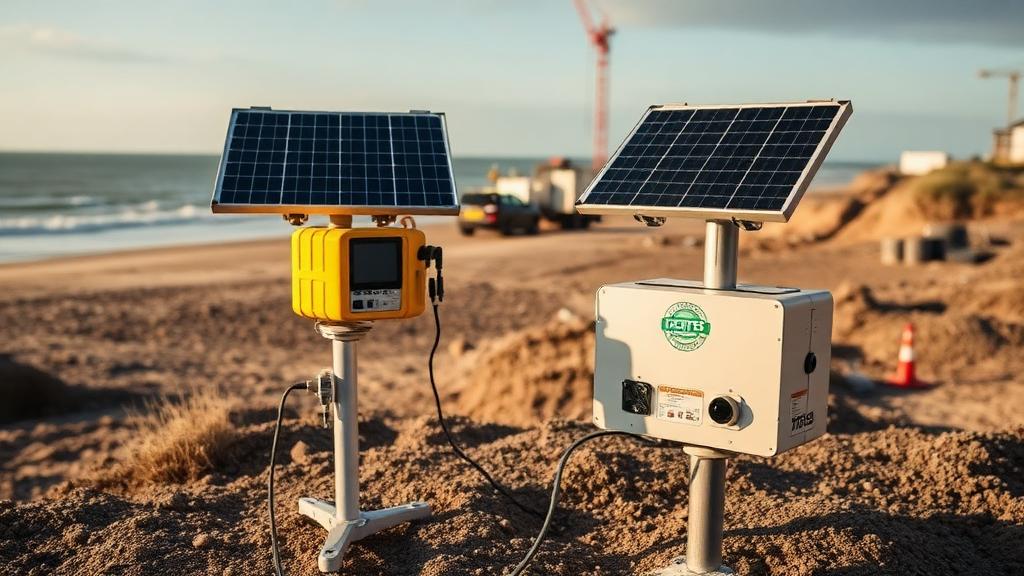
Solar-powered and battery-operated systems — For remote sites without mains power
Cloud-connected data loggers — Real-time data access, alert thresholds and automated reporting
How Ambient Monitoring Works in Practice
A well-designed monitoring programme answers specific questions: Are pollutant levels already elevated? What is the contribution from traffic, industry or construction? How does exposure vary by season and weather? Our approach combines technical rigour with practical deployment:
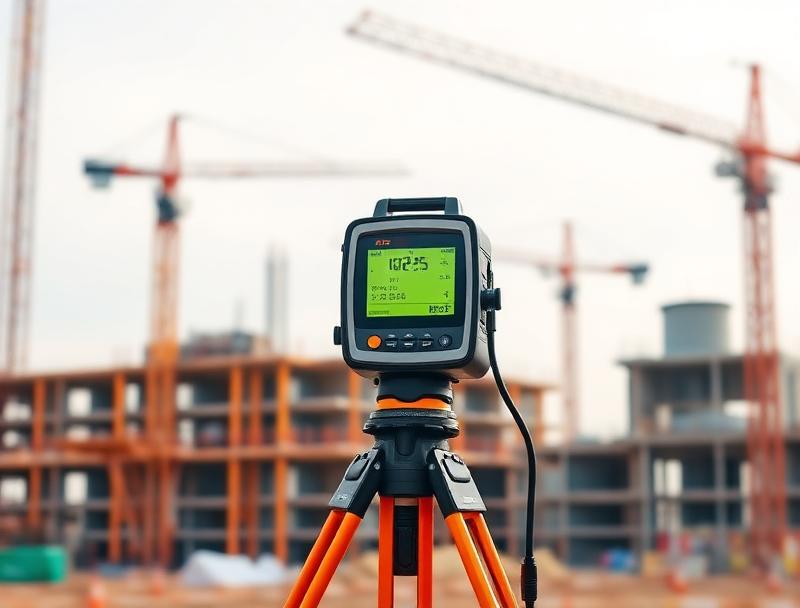
Step 1: Scoping — Define the monitoring objective, pollutants, duration and locations based on the planning or compliance question
Step 2: Site survey — Identify optimal monitoring positions considering receptor exposure, source proximity, access and security
Step 3: Equipment deployment — Install, calibrate and commission monitoring equipment with full QA/QC protocols
Step 4: Data capture — Continuous logging with remote data access, daily checks and maintenance schedules
Step 5: Data validation — Quality control, annualisation (where required), bias adjustment for diffusion tubes, and meteorological analysis
Step 6: Reporting — Interpretation against Air Quality Objectives, comparison with national/local datasets, and planning-ready conclusions
UK Air Quality Objectives and Limit Values
Monitoring results are assessed against the UK Air Quality Objectives set under the Environment Act 1995 and retained EU limit values:
NO2: 40 µg/m³ annual mean, 200 µg/m³ 1-hour mean (not to be exceeded more than 18 times per year)
PM10: 40 µg/m³ annual mean, 50 µg/m³ 24-hour mean (not to be exceeded more than 35 times per year)
PM2.5: 20 µg/m³ annual mean (with WHO guideline of 5 µg/m³ annual mean for health-based assessment)
SO2: 125 µg/m³ 24-hour mean, 350 µg/m³ 1-hour mean
CO: 10 mg/m³ maximum daily 8-hour running mean
Benzene: 5 µg/m³ annual mean
Standards, Guidance and Regulatory Context
Our ambient monitoring programmes are designed in accordance with:
Defra LAQM Technical Guidance TG(22) — Local Air Quality Management monitoring standards
IAQM/EPUK Planning for Air Quality guidance — Proportionate monitoring for planning evidence
MCERTS certification — Environment Agency Monitoring Certification Scheme for regulatory-grade data
EN 12341 (PM10/PM2.5 gravimetric reference method) and EN 14211 (chemiluminescent NOx)
Defra diffusion tube QA/QC guidance and national bias adjustment factors
WHO Air Quality Guidelines (2021) — Health-based assessment benchmarks
What the Service Delivers
Monitoring plan with site-specific rationale, pollutant scope, locations and duration
Equipment deployment, calibration and maintenance throughout the monitoring period
Quality-controlled datasets with full audit trail and meteorological analysis
Annualised results and bias-adjusted data where applicable
Planning-ready monitoring report with conclusions against UK Air Quality Objectives
Real-time data access and alert notifications (for continuous monitoring programmes)
Integration with Air Quality Assessments and dispersion modelling where required
Who This Is For
Developers and planning consultants needing baseline air quality evidence
Industrial and commercial operators meeting Environmental Permit monitoring conditions
Construction companies requiring IAQM-compliant dust monitoring programmes
Local Authorities commissioning monitoring for AQMA review and assessment
How long should ambient air quality monitoring run for?
It depends on the objective. Diffusion tube campaigns typically run for 3-12 months for annual mean assessment. Short-term continuous monitoring (2-4 weeks) can support targeted investigations. Planning-related monitoring is designed to be proportionate to the question and risk.
Do I need continuous monitoring or diffusion tubes?
Diffusion tubes are cost-effective for NO2 baselines at multiple locations. Continuous monitoring provides higher time resolution for PM10/PM2.5, event analysis and real-time alerts. We recommend the method based on your planning or compliance requirement.
Can ambient monitoring replace an Air Quality Assessment?
Not usually. Monitoring provides measured evidence of existing conditions. An Air Quality Assessment interprets future impacts using that data plus dispersion modelling. They work best together — monitoring strengthens the assessment.
What is the difference between MCERTS and indicative monitoring?
MCERTS certified monitoring meets Environment Agency quality standards and produces regulatory-grade data suitable for permit compliance. Indicative monitoring uses less expensive equipment for screening, construction dust or short-term investigations where full MCERTS is not required.
Can you monitor near schools and hospitals?
Yes. We regularly deploy monitors near sensitive receptors including schools, hospitals, care homes and residential properties. Equipment is secured, unobtrusive and tamper-resistant.
Do you provide real-time air quality monitoring data?
Yes. Our continuous monitoring systems provide cloud-connected real-time data access with customisable alert thresholds for PM10, PM2.5, NO2 and other pollutants.
What pollutants can Alkali monitor?
We monitor the full UK Air Quality Objective suite: NO2 (diffusion tube and chemiluminescent), PM10 and PM2.5 (BAM/TEOM/optical), SO2, CO, O3, benzene and other VOCs, plus heavy metals (Pb, As, Cd, Ni) via PM10 filter analysis. Bespoke monitoring for industrial process pollutants is available where MCERTS or equivalent reference methods exist.
How quickly can monitoring equipment be deployed?
Diffusion tube campaigns can start within a few days of order. Continuous PM10/PM2.5 and NOx monitors are typically deployed UK-wide within 1-2 weeks, including site survey, secure mounting, calibration, commissioning and remote data access setup.
Get environmental compliance quotes online
Skip the back-and-forth. Add the services you need, share your permit or scope, and Alkali responds with a clear, fixed-fee proposal — usually within one working day. Faster scoping, fewer emails, more accurate quotes.
Acute Exposure Guideline Levels (AEGLs) were developed by the US Environmental Protection Agency to evaluate the potential health impacts of accidental chemical releases into the air. They define concentration thresholds for three effect levels:
Approach
Alkali Consultants deployed their in-house AEGL specialist, applying ADMS dispersion modelling software to calculate NO₂ AEGL concentrations (ppm) at 40 sensitive receptors surrounding the proposed data centre. Close collaboration with the client ensured the EA's requirements were fully addressed at each stage. By combining international best practice with rigorous modelling, Alkali Consultants demonstrated the flexibility to meet regulatory demands beyond conventional UK frameworks.
Outcome
All five time-period objectives for NO₂ AEGLs were achieved.
During construction activity at a landfill site near Lynemouth Beach, air quality and noise impacts were a key concern. Planning conditions required real-time monitoring to protect nearby sensitive receptors, including residents and site operatives, from the effects of dust and noise exposure.
Approach
Air quality monitoring was undertaken at three locations using MCERTS Indicative certified monitors, positioned both upwind and downwind of construction activities.
Outcome
Continuous monitoring met all planning condition requirements.